Go to to your AWS CLoudWatch dashboard.
Select the dashboard in which you want to show the disk used percentage.
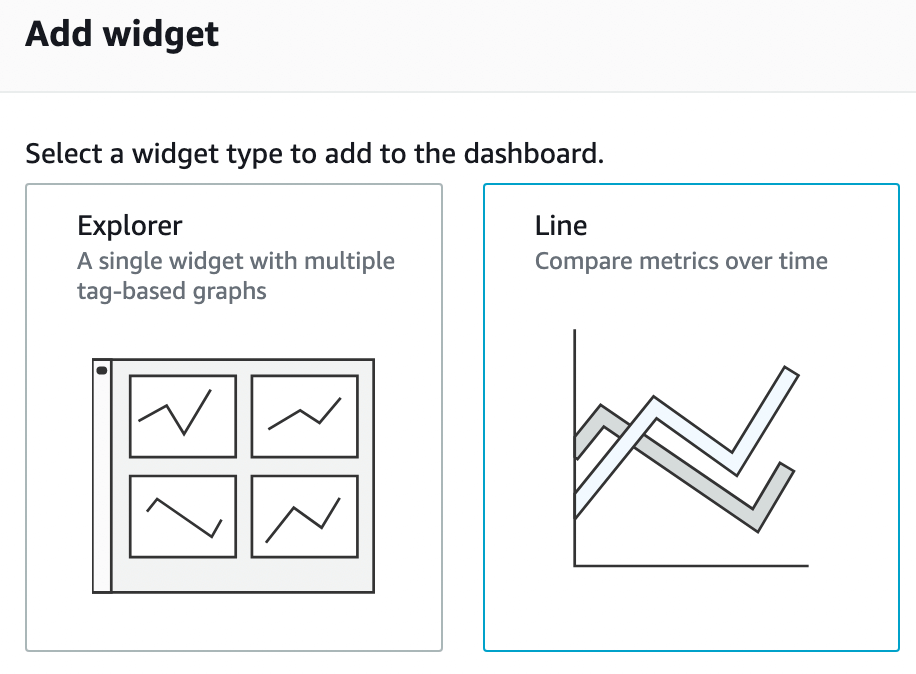
Click Add widget and select Line graph.
On the next screen, choose Metrics.
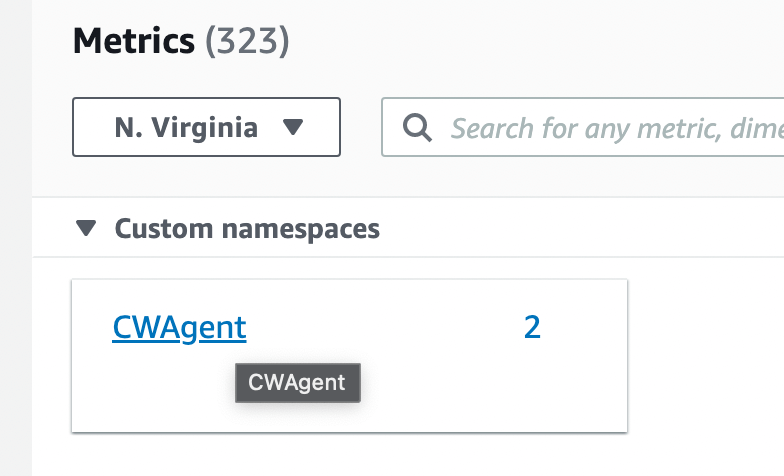
Select the namespace where you have metric set for the alarm
Select the instance in the Metics list.
Click Create Widget button.
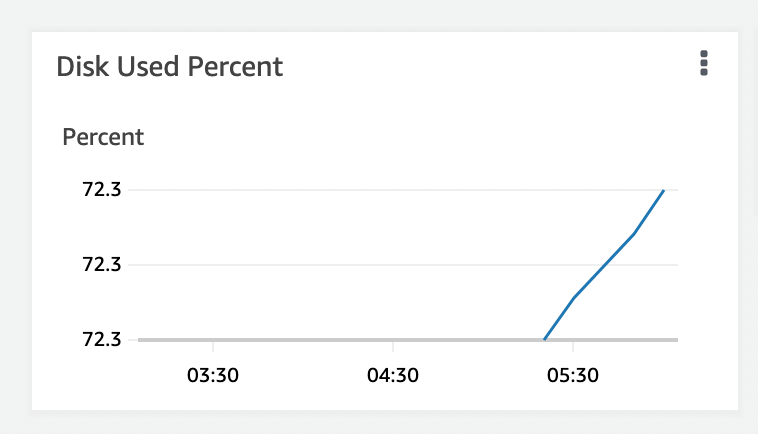
Disk used percentage widget will start coming on the dashboard.